A Technical Deep-Dive into Benchmarking Hospital Cost Per Discharge
Introduction: The Efficiency Question
In hospital operations, a key indicator of efficiency is the “cost per inpatient discharge.” It’s a simple concept: on average, how much does it cost to treat one patient from admission to discharge? Knowing this number is useful, but knowing how it stacks up against similar hospitals is what provides true strategic insight.
A hospital executive needs to know: “For fiscal year 2022, where does our hospital rank in cost per inpatient discharge compared to other hospitals in our state with a similar number of beds (±20%)?”
This seems like a straightforward question, but like many things in healthcare finance, the data is buried in the HCRIS database. Answering it requires navigating the complexities of the HCRIS data structure to extract the right data points and perform the correct calculations.
At Spectral Health, we’ve automated this process. Here’s a look at the exact BigQuery SQL we use to go from this plain-English question to a direct, actionable answer in seconds.
The SQL Deep-Dive: From Raw Data to Ranked Peers
Here is the complete query. We’ll break it down step-by-step to show how it works.
/* FY-2022 · Cost per Inpatient Discharge   Target: CCN 372018 · Peers: same state, beds ±20 %          */
-- latest report per CCNWITH rpt AS (  SELECT PRVDR_NUM AS ccn, RPT_REC_NUM  FROM   `hcris-demo.data.HOSP10_ALL_RPT`  WHERE  EXTRACT(YEAR FROM PARSE_DATE('%m/%d/%Y', FY_END_DT)) = 2022  QUALIFY ROW_NUMBER() OVER (PARTITION BY PRVDR_NUM ORDER BY RPT_REC_NUM DESC)=1),
-- name + state from S-2alpha AS (  SELECT    r.ccn,    MAX(IF(a.WKSHT_CD='S200001' AND a.LINE_NUM=300 AND a.CLMN_NUM='00100',           a.ALPHNMRC_ITM_TXT,NULL)) AS name,    MAX(IF(a.WKSHT_CD='S200001' AND a.LINE_NUM=200 AND a.CLMN_NUM='00200',           a.ALPHNMRC_ITM_TXT,NULL)) AS st  FROM rpt r  JOIN `hcris-demo.data.HOSP10_ALL_ALPHA` a    ON a.RPT_REC_NUM=r.RPT_REC_NUM  GROUP BY ccn),
-- beds, discharges, cost from NMRCnmrc AS (  SELECT    r.ccn,    MAX(IF(n.WKSHT_CD='S300001' AND n.LINE_NUM=1400 AND n.CLMN_NUM='00200',           CAST(n.ITM_VAL_NUM AS INT64),NULL))                AS beds,    MAX(IF(n.WKSHT_CD='S300001' AND n.LINE_NUM=1400 AND n.CLMN_NUM='01500',           CAST(n.ITM_VAL_NUM AS FLOAT64),NULL))              AS disch,    SUM(IF(n.WKSHT_CD='C000001' AND n.CLMN_NUM='00100'        AND ((n.LINE_NUM BETWEEN 3000 AND 4699) OR (n.LINE_NUM BETWEEN 5000 AND 7799)),        CAST(n.ITM_VAL_NUM AS FLOAT64),0))                    AS cost  FROM rpt r  JOIN `hcris-demo.data.HOSP10_ALL_NMRC` n    ON n.RPT_REC_NUM=r.RPT_REC_NUM  GROUP BY ccn),
-- combine metricsm AS (  SELECT    n.ccn, a.name, a.st, n.beds, n.disch,    n.cost, n.cost/NULLIF(n.disch,0) AS cpd  FROM nmrc n JOIN alpha a USING(ccn)),
-- target valuest AS (SELECT st, beds FROM m WHERE ccn=372018),
-- peers + rankpeer AS (  SELECT m.*,         RANK() OVER(ORDER BY cpd) AS peer_rank  FROM m, t  WHERE m.st=t.st    AND m.beds BETWEEN t.beds*0.8 AND t.beds*1.2    AND m.beds IS NOT NULL AND m.disch IS NOT NULL AND m.cost IS NOT NULL)
SELECT  ccn,  name AS provider_name,  beds,  ROUND(cpd,2) AS cost_per_discharge,  peer_rankFROM peerORDER BY peer_rank;
Step 1: Find the Latest Report (rpt)
Hospitals can refile their cost reports, creating multiple records for the same fiscal year. We use the QUALIFY ROW_NUMBER() OVER(...) clause to ensure we only analyze the most recent report for each hospital in fiscal year 2022.
Step 2: Get Hospital Name and State (alpha)
We pull the provider’s name and state from Worksheet S2. This worksheet contains general information about the hospital.
Step 3: Extract Beds, Discharges, and Costs (nmrc)
This is where we dig into the numeric data. We pull three key metrics:
- Beds: The number of available beds, from Worksheet S3.
- Discharges: The total number of inpatient discharges, also from Worksheet S3.
- Cost: The total inpatient cost, which we calculate by summing the relevant lines from Worksheet C, Part I.
Step 4: Combine Metrics and Calculate Cost Per Discharge (m)
With the raw data extracted, we join our temporary tables and calculate the core metric: cost / discharges. We use NULLIF(n.disch, 0) to avoid any divide-by-zero errors.
Step 5: Define the Peer Group and Rank (t, peer)
This is the crucial step for benchmarking.
t(target): First, we create a small temporary tabletcontaining just the state and bed count for our specific hospital (CCN 372018).peer: Then, we filter our main metrics tablembased on the values int. TheWHERE m.st = t.stclause ensures we only look at hospitals in the same state. TheWHERE m.beds BETWEEN t.beds * 0.8 AND t.beds * 1.2clause narrows the list down to only facilities with a similar bed size (±20%). Finally, we use theRANK()window function to rank these peers by their calculated cost per discharge (cpd).
The Result: A Clear Answer
The query returns a clean, ranked list, which can be visualized to give an immediate sense of where the hospital stands among its peers. (We’re continuously refining our chart designs, but even this simple view makes the result clear):
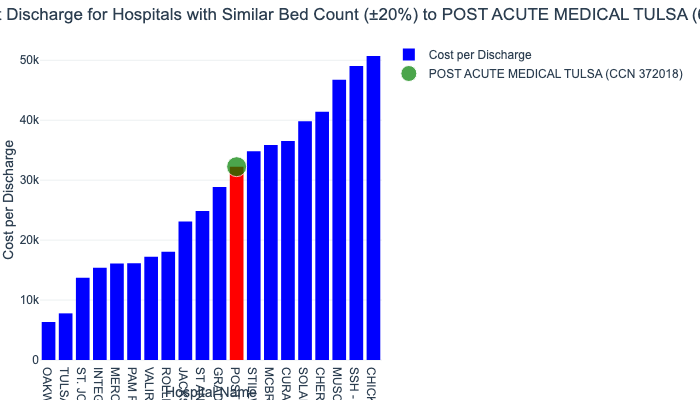
The final output is a simple table, ready for analysis or export. It shows that for FY2022, Post Acute Medical Tulsa (CCN 372018) ranks 12th among its peers in Oklahoma with a cost per discharge of $32,249.14.
| ccn | provider_name | beds | cost_per_discharge | peer_rank |
|---|---|---|---|---|
| 374025 | OAKWOOD SPRINGS | 72 | 6337.75 | 1 |
| 374026 | TULSA CENTER FOR BEHAVIORAL HEALTH | 56 | 7781.0 | 2 |
| 373034 | ST. JOHN REHABILITATION HOSPITAL AN | 60 | 13706.23 | 3 |
| 370211 | INTEGRIS CANADIAN VALLEY HOSPITAL | 66 | 15376.81 | 4 |
| 373033 | MERCY REHAB HOSPITAL OKLAHOMA CITY | 66 | 16108.0 | 5 |
| 373035 | PAM REHAB HOSPITAL OF TULSA | 53 | 16143.6 | 6 |
| 373025 | VALIR REHAB HOSPITAL | 50 | 17223.45 | 7 |
| 374016 | ROLLING HILLS HOSPITAL | 60 | 18050.03 | 8 |
| 370022 | JACKSON COUNTY MEMORIAL HOSPITAL | 49 | 23085.79 | 9 |
| 370149 | ST ANTHONY SHAWNEE HOSPITAL | 57 | 24846.77 | 10 |
| 370054 | GRADY MEMORIAL HOSPITAL | 48 | 28849.94 | 11 |
| 372018 | POST ACUTE MEDICAL TULSA | 60 | 32249.14 | 12 |
| 370049 | STILLWATER MEDICAL CENTER | 52 | 34807.02 | 13 |
| 370222 | MCBRIDE CLINIC ORTHOPEDIC HOSPITAL | 68 | 35876.66 | 14 |
| 372004 | CURAHEALTH OKLAHOMA CITY | 59 | 36537.07 | 15 |
| 372022 | SOLARA HOSPITAL MUSKOGEE | 64 | 39835.82 | 16 |
| 370171 | CHEROKEE NATION WW HASTINGS HOSPITAL | 52 | 41427.26 | 17 |
| 370057 | MUSCOGEE CREEK NATION MED CENTER | 50 | 46736.38 | 18 |
| 372009 | SSH - OKLAHOMA CITY INC. | 72 | 49023.06 | 19 |
| 370180 | CHICKASAW NATION MEDICAL CENTER | 72 | 50711.98 | 20 |
Conclusion: From Complexity to Clarity
This example shows how Spectral Health transforms a complex analytical task into a simple, repeatable process. By handling the intricacies of HCRIS data, we provide clear, accurate, and timely insights that empower healthcare leaders to make data-driven decisions.