A Technical Deep-Dive into Benchmarking Hospital Operating Margins
Introduction: The Deceptively Simple Question
In the world of hospital finance, one of the most fundamental questions an executive can ask is: “How is our operating margin performing compared to our peers?” It sounds simple. In reality, answering it has traditionally been a nightmare of data wrangling, domain expertise, and days—if not weeks—of an analyst’s time.
This isn’t a quick Google search. The data required lives in the Healthcare Cost Report Information System (HCRIS), a public dataset published by the Centers for Medicare & Medicaid Services (CMS). It’s a goldmine, but it’s also a beast.
The Manual Nightmare: Why HCRIS Is So Tough
If you wanted to answer that simple question manually, here’s what you’d be up against:
-
Sourcing the Data: First, you have to get the data from the official CMS website. You’d need to download the files for every fiscal year you want to analyze.
-
The “Excel Breaking” Problem: You can immediately forget about using spreadsheet software. Taking the
HOSPITAL-2010dataset for a single year like 2020 as an example, the numeric data file is around 700 MB and the alphabetic data file is another 150 MB. Multiply that by seven years of data (2015-2021), and you’re dealing with many gigabytes of raw data. You need a proper database, and the skills to manage it, just to get started. -
Deep Domain Knowledge: The data is organized in a way that mirrors the paper forms hospitals submit. To find “Operating Income” or “Net Patient Revenue,” you can’t just look for a column with that name. You need to know that you’re looking for Worksheet G-3, Line 500, Column 1 for operating income, and Line 300 for revenue. This requires constant cross-referencing of arcane documentation.
At Spectral Health, we’ve automated this entire process. We’ll show you exactly how a plain-English request triggers a powerful BigQuery query that returns the answer in under 30 seconds.
The Anatomy of the Request
A user can simply ask:
“What was the operating margin for provider number 222002 from 2015 to 2021, compared to the state average and national median?”
This single sentence is the key that unlocks a multi-step SQL query. A “provider number” (also called a CCN) is just the unique ID CMS assigns to each hospital. Our system parses this request and constructs the following BigQuery query to run against our HCRIS data warehouse.
The SQL Deep-Dive: Breaking Down the 5 Steps to Insight
Here is the exact query, which we’ll break down step-by-step.
/*---  Operating margin for CCN 222002, FY 2015-2021, compared with  state average (with standard deviation) and national median  (with interquartile range).-----*/
--  1.  Pick the latest cost-report for each {provider, year} --WITH latest_reports AS (  SELECT    PRVDR_NUM                            AS ccn,           -- INT64    RPT_REC_NUM,    EXTRACT(YEAR FROM SAFE.PARSE_DATE('%m/%d/%Y', FY_END_DT))                                        AS fiscal_year,    ROW_NUMBER() OVER (PARTITION BY PRVDR_NUM,                                     EXTRACT(YEAR FROM SAFE.PARSE_DATE('%m/%d/%Y', FY_END_DT))                       ORDER BY RPT_REC_NUM DESC) AS rn  FROM `hcris-demo.data.HOSP10_ALL_RPT`  WHERE SAFE.PARSE_DATE('%m/%d/%Y', FY_END_DT)        BETWEEN DATE '2015-01-01' AND DATE '2021-12-31'),chosen_reports AS (  SELECT ccn, RPT_REC_NUM, fiscal_year  FROM   latest_reports  WHERE  rn = 1),
-- - 2.  Pull G-3 line 300 & 500 + provider state ---g3_lines AS (  SELECT    cr.ccn,    cr.fiscal_year,    COALESCE(CAST(alpha_state.ALPHNMRC_ITM_TXT AS STRING), 'UNK') AS state,    MAX(CASE WHEN nmrc.LINE_NUM = 300 THEN CAST(nmrc.ITM_VAL_NUM AS FLOAT64) END)      AS net_patient_revenue,    MAX(CASE WHEN nmrc.LINE_NUM = 500 THEN CAST(nmrc.ITM_VAL_NUM AS FLOAT64) END)      AS operating_income  FROM chosen_reports cr  JOIN `hcris-demo.data.HOSP10_ALL_NMRC` nmrc       ON nmrc.RPT_REC_NUM = cr.RPT_REC_NUM      AND nmrc.WKSHT_CD    = 'G300000'      AND nmrc.CLMN_NUM    = '00100'      AND nmrc.LINE_NUM   IN (300, 500)  LEFT JOIN `hcris-demo.data.HOSP10_ALL_ALPHA` alpha_state       ON alpha_state.RPT_REC_NUM = cr.RPT_REC_NUM      AND alpha_state.WKSHT_CD    = 'S200001'      AND alpha_state.LINE_NUM    = 200      AND alpha_state.CLMN_NUM    = '00200'      -- provider state  GROUP BY cr.ccn, cr.fiscal_year, state),
--  3.  Calculate operating-margin pct --margins AS (  SELECT    ccn,    fiscal_year,    state,    ROUND(100 * SAFE_DIVIDE(operating_income, net_patient_revenue), 2)      AS operating_margin_pct  FROM g3_lines  WHERE net_patient_revenue IS NOT NULL    AND operating_income     IS NOT NULL),
--  4.  Derive comparison sets --hospital AS (  SELECT fiscal_year,         ccn,         operating_margin_pct AS hospital_margin_pct,         state  FROM   margins  WHERE  ccn = 222002),
-- state_avg now with standard deviation and N countstate_avg AS (  SELECT fiscal_year,         state,         ROUND(AVG(operating_margin_pct), 2) AS state_avg_margin_pct,         ROUND(STDDEV(operating_margin_pct), 2) AS state_stddev_margin_pct,         COUNT(ccn) AS state_n  FROM   margins  GROUP BY fiscal_year, state),
-- national_stats calculates quartiles for IQR and N countnational_stats AS (  SELECT fiscal_year,         COUNT(ccn) AS national_n,         APPROX_QUANTILES(operating_margin_pct, 4) AS national_quartiles  FROM   margins  GROUP BY fiscal_year)
-- 5.  Final answer ---SELECT  h.fiscal_year,  h.ccn,  h.hospital_margin_pct,
  s.state_avg_margin_pct,  s.state_stddev_margin_pct,  s.state_n,
  n.national_quartiles[OFFSET(2)] AS national_median_margin_pct,  -- Calculate Interquartile Range (IQR) as Q3 - Q1  ROUND(n.national_quartiles[OFFSET(3)] - n.national_quartiles[OFFSET(1)], 2)    AS national_iqr_margin_pct,  n.national_n
FROM hospital hLEFT JOIN state_avg      s ON h.fiscal_year = s.fiscal_year                           AND h.state       = s.stateLEFT JOIN national_stats n ON h.fiscal_year = n.fiscal_yearORDER BY h.fiscal_year;
Step 1: Finding the Needle in the Haystack (latest_reports)
A crucial complication is that hospitals often refile their cost reports. A simple query for “2021” might pull multiple versions of the report for the same hospital. We only want the most recent one. We solve this with a window function: ROW_NUMBER() OVER (PARTITION BY ... ORDER BY RPT_REC_NUM DESC). This assigns a rank to each report for a given hospital and year, with the highest RPT_REC_NUM (report record number) getting rank #1. We then simply select where rn = 1.
Step 2: Extracting the Key Financials (g3_lines)
This is where the domain knowledge comes in. The raw numeric data is in a long format (one row per line item). We need to pivot this into columns. We do this by joining to our chosen_reports and filtering for the exact worksheet (G300000), column (00100), and lines (300 and 500) we need. The MAX(CASE WHEN ...) pattern is a standard SQL trick to perform this pivot, creating columns for net_patient_revenue and operating_income. We also LEFT JOIN to another table to grab the hospital’s state for our later comparison.
Step 3: The Core Calculation (margins)
With our data properly structured, the core calculation is simple: operating_income / net_patient_revenue. We use SAFE_DIVIDE as a best practice to gracefully handle any cases where revenue might be zero, preventing the query from crashing.
Step 4: Building the Benchmarks (hospital, state_avg, national_median)
Now we create three separate, focused datasets for our comparison:
hospital: We filter ourmarginstable for only the specific CCN we care about (222002).state_avg: We group all hospitals byfiscal_yearandstateand calculate theAVG(operating_margin_pct).national_median: We group all hospitals byfiscal_yearand use BigQuery’s powerfulAPPROX_QUANTILES()function to efficiently calculate the median (the 50th percentile). This is far more performant than other methods for calculating medians on large datasets.
Step 5: Assembling the Final Answer
The final step is to bring it all together. We start with our single hospital’s data and LEFT JOIN the state and national benchmarks for each corresponding year. The result is a clean, year-by-year table that directly answers the user’s question.
The final output is this simple, powerful chart:
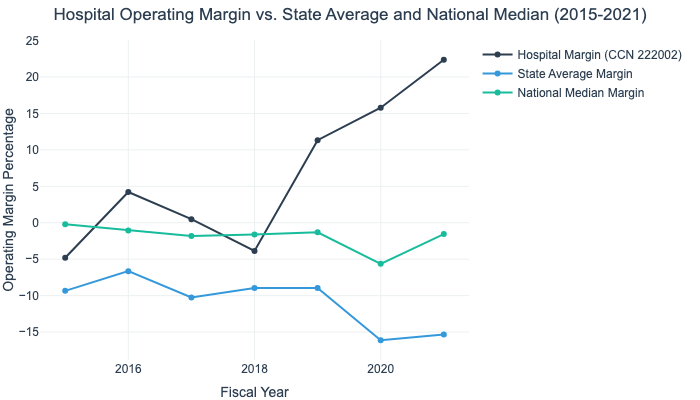
The query also returns data in CSV format. The table below shows the complete dataset that generated the chart, with the standard deviation for the state average, the interquartile range (IQR) for the national median, and the number of hospitals (N) in each comparison group.
| Fiscal Year | Your Margin | State Avg. (Std Dev) | State N | National Median (IQR) | National N |
|---|---|---|---|---|---|
| 2015 | -4.80% | -9.34% (34.63) | 92 | -0.32% (17.07) | 5,863 |
| 2016 | 4.21% | -6.64% (22.00) | 90 | -0.78% (17.71) | 5,866 |
| 2017 | 0.49% | -10.25% (21.99) | 89 | -2.00% (19.21) | 5,844 |
| 2018 | -3.86% | -8.94% (24.65) | 88 | -1.74% (18.94) | 5,808 |
| 2019 | 11.33% | -8.96% (24.56) | 89 | -1.41% (18.99) | 5,788 |
| 2020 | 15.78% | -16.12% (29.30) | 88 | -5.59% (22.45) | 5,758 |
| 2021 | 22.36% | -15.32% (40.09) | 89 | -1.70% (22.06) | 5,772 |
Why This is a Game-Changer
Let’s contrast the two approaches:
| Attribute | Manual Process | Spectral Health Process |
|---|---|---|
| Time | Days or weeks of an analyst’s time. | Under 30 seconds. |
| Infrastructure | User must set up and maintain their own database. | Handled entirely by our managed BigQuery instance. |
| Expertise | Requires deep SQL and HCRIS schema knowledge. | Requires asking a question in plain English. |
This query is just one example. By embedding this logic into our platform, we abstract away the immense technical complexity and empower users to focus on the strategic insights, not the data janitorial work.
Conclusion: Empowering Decisions with Accessible Data
Our mission is to take this incredibly valuable but notoriously difficult public dataset and make it accessible to everyone. The goal isn’t just about running queries faster; it’s about enabling healthcare finance professionals, consultants, and researchers to make better, more informed decisions without needing a data engineering team on retainer.
What question would you ask the entire HCRIS database if you could? Come give it a try on our free tier and see what you can uncover.